


Porter’s Five Forces Unpack Cannabis Sector Pressures: Insights for 2025 Investors


LOS ANGELES – The boards of multi-state operators and decision-makers orchestrating Cannabis deals, investors and analysts, the experts behind cultivation ops in emerging markets and the multilevel executives in our industry often turn to a classic tool for dissecting profit margins: Michael Porter’s Five Forces Framework.
Debuted in 1979, the approach examines competitive pressures through threats of new market players and alternative products, leverage held by suppliers and purchasers, plus direct contender clashes, all factors that define sector appeal and rate-setting ability.
In Cannabis, a worldwide business expected to generate $72.83 billion in 2025 revenues and set to hit $125.76 billion by 2030 with an 11.5% compound annual growth rate (CAGR), these components spotlight federal fiscal burdens, unauthorized trade intrusions, and merger priorities. Within the U.S., adult-use availability covers 24 states, pushing yearly totals near $46.99 billion amid 47% usage among adults and 79% access to regulated points. Beyond borders, Canada’s $6.18 billion established system differs from Germany’s surge after 2024 policy shifts, where medical sales could approach €650 million by 2030. This breakdown integrates financial metrics to inform investment choices, contrasting domestic steadiness with overseas fluctuations.
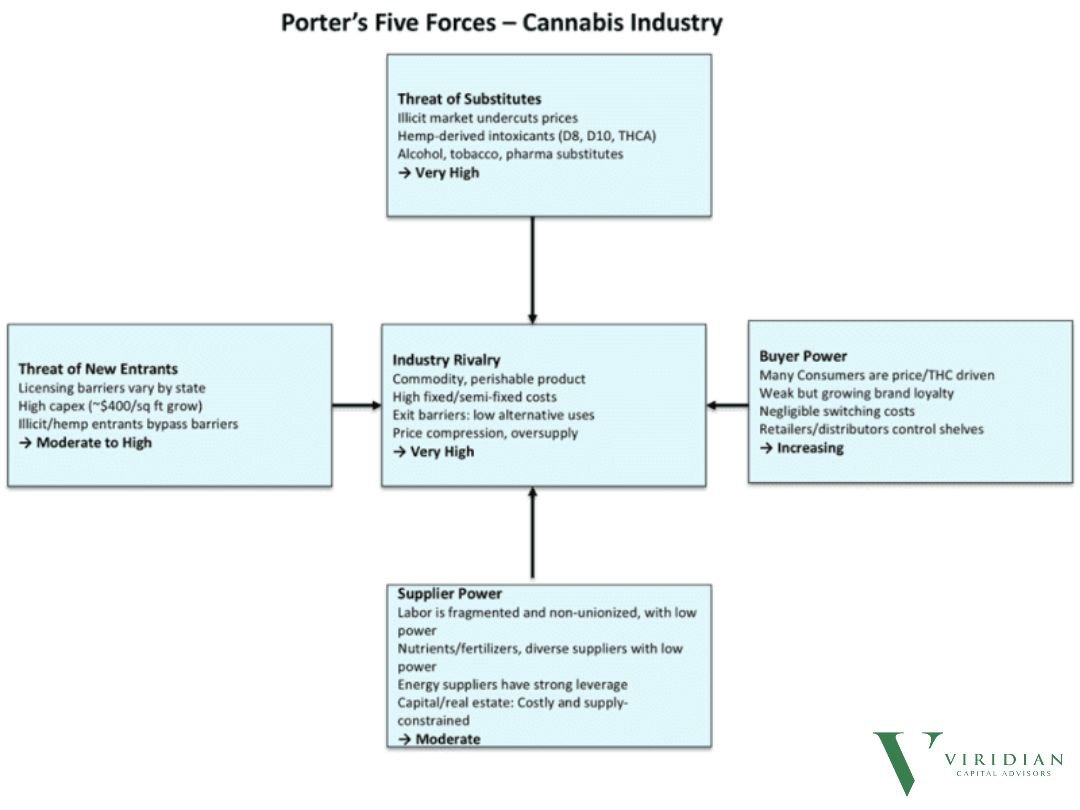
Threat of Substitutes: Very High Drag from Unauthorized & Established Competitors
Alternatives exert substantial pull-on Cannabis profitability, heightened by unauthorized channels undercutting through unregulated hemp variants like Delta-8, Delta-10, and THCA, coupled with staples of alcohol, tobacco, and prescription drugs offering minimal transition expenses for users. In the U.S., this shows up prominently: hemp-based items claim shares in the $20 billion CBD space by the end of 2025, cutting into flower values by 25% when measured per THC unit, as consumers shift to lower-cost, nationally permissible options per the 2018 Farm Bill [and its loophole, obviously]. Public operators trade at 1-2x sales ratios (below biotech norms) in part from this leakage, with unlicensed segments claiming 70% of overall intake despite tighter controls.
Overseas, the equation intensifies. Canadian outlets cede turf to lab-made cannabinoids, while Europe’s budding adult-use in Germany battles heritage plants and painkillers, restraining therapeutic revenue growth to 15%. Israel’s export figures, projected around $11 million from peers like Colombia, encounter generic drug challenges as proof of Cannabis utility draws wider rivals. Numerically, this element holds sector returns at 10-15% in developed U.S. areas, against 20%+ in protected categories like vaporizers; absent brand strengthening, alternatives might trim $5-7 billion from 2030 worldwide estimates, emphasizing needs for proprietary edges to regain rate control.
Threat of New Entrants: Moderate to High Defenses Offset by Sidesteps
Access hurdles stand at moderate-to-high tiers, influenced by per-state permit differences, unlicensed actors dodging oversight safeguards, and investments topping $400 per square foot for rule-abiding facilities, though these protections weaken during growth spurts. U.S. veterans gain from embedded rule-following setups, yet Section 280E taxation, barring standard write-offs, and permit draws in places like Florida & Pennsylvania attract venture funds, with capital inflows nearly doubling to average $20.4 million per transaction from 2023 levels. Such activity bolsters size benefits, allowing leading MSOs to post aggregate 2025 returns sufficient for $500 million debt payoffs and $1-2 billion in upgrades without strain, as credit evaluations confirm.
Internationally, safeguards splinter more. Canada’s permit overflow [over 600 entities] repels through wholesale dips under $2 per gram, squeezing returns, whereas Germany’s 2024 possession updates sparked a 200% permit request jump, testing shippers like Tilray with hastened buys. Projections see $2-3 billion in transnational capital by 2026, likely thinning U.S.-level 10-15% yields in Europe to low single figures absent unified continental rules. From a metrics standpoint, this pressure indicates prospects in fortifying barriers: firms enhancing intellectual property and logistics might secure 20% valuation uplifts, flipping entry risks into buyout streams.
Supplier Power: Moderate Holds from Scattered Resources
Input providers carry moderate weight, grounded in dispersed, non-organized workforces with slight pull; varied nutrient and soil enhancers lacking rate dominance; and stronger grip from power utilities plus funding- and property-limited grow spots. U.S. multi-state groups counter this via in-house sourcing [Green Thumb Industries handles 70% internally], dampening swings as worldwide production expenses rose amid power surges, with indoor ops using 1% of national electricity and rivaling crypto in demand. Still, niche strains and setups stay concentrated, allowing sellers brief spikes during breaks like California’s dry spells, which boosted area power tabs by 12% recently.
In shipment-focused zones, patterns heighten. Colombia’s raw material sources, bound by land caps, pull 15-20% extras for Europe-directed medical tiers, against U.S. norms where broad Midwest options keep holds balanced. This tempering limits input-driven rises to 5-7% yearly, yet alerts flag escalations: facing $911 million in 2025 U.S. levies under 280E scenarios, a 10% supply bump could cut sector cash by $200 million. Tactically, locks through extended agreements and clean energy shifts, cutting 15% of investments in merged outfits, equip frontrunners to flip this pressure from expense drag to performance boost.
Buyer Power: Increasing Clout Via Rate Awareness
Purchaser influence climbs consistently, driven by crowds of value- and potency-seeking buyers showing faint, yet budding, label fidelity, zero shift outlays, and store or channel command over display spots. In the U.S., giants like Curaleaf lock in 20-30% yearly bulk cuts, pressing established areas to $250 per ounce with comparison tools and doorstep services widespread. This sameness trend, monitored in reports, halved label extras since 2022, urging moves to 25% better-yield types like consumables, now 35% of leisure blends.
Worldwide, the pinch firms in controlled fields. Australian bids for 70% foreign medical inventory net 18% bulk yields, while Canadian dealers insist on unlicensed parallels, wearing down shipment markups by 15% from 2023. Insights link this to value bases, listed firms at 1.5x enterprise-to-sales, while noting defenses: retention schemes in 40% of outlets raised returns by 12%, from early 2025 reviews. Analytically, rising buyer sway predicts 5-8% rate drops to 2027 unless info-led tailoring [like AI for variety fits] turns the flow, possibly reclaiming $3-4 billion in lost income.
Industry Rivalry: Very High Vigor Spurs Rate & Volume Fights
Clashes peak at very high levels, sparked by quick-spoil basics needing fast cycles, hefty fixed and partial-variable spends, few redirects for unused gear, and easy rate floors during surplus floods. U.S. fronts like Oklahoma capture the strife: 40% shadow undercuts halved lawful outlet takes to $2.5 million each year, triggering 30% solo player drops through merger waves poised for 2025 upticks after 2024 lulls. Sunk investments in facilities [often 60% of outlays] fuel aggressive offers, with 2025 totals holding at $47 billion despite unit increases.
Globally, Canada’s maker excess maintains wholesale under $2 per gram, while Germany’s €2-2.50 steadiness wavers under request booms, delivering net yields under 5% for names like Aurora. Credit views highlight durability: 2025’s low-stress setup, with returns covering $1.4 billion duties, opposes 2026’s $2 billion payoff cliff, spurring early ties. This peak element, via models, upholds modest multiples but offers gains: additions through purchases could lift capital returns to 12%, shaping rivalry’s heat into a yield hammer.
From a fiscal angle, 2025 signals guarded promise for U.S. multi-state groups, with flows surpassing $911 million in 280E charges and $500 million obligations, still requiring $1-2 billion investments for advances against alternatives and clashes. Offshore ventures, lifted by North America’s $285 billion 2034 outlook, need to balance policy boosts against purchaser wears for 20%+ internal rates.
This Porter dissection crystallizes the sector’s mandate: amid $13.8 billion in 2025 capital infusions, triumph accrues to those alchemizing forces [be it through consolidation, integration, or innovation] into fortified moats, ensuring not mere endurance but commanding yields in a trade locked and loaded for $150 billion global scale by 2033.
Here, sharp planning doesn’t merely weather storms.
It reaps the winds.
Inspired by: Viridian Capital Advisors
About the Author: HCN News Team
Related Posts